Contents
Studies on Covid-19 Lethality
Updated: November 2021
Published: May 2020
Share on: Twitter / Facebook
Powered by
Overview
1) Antibody studies ⇓ 2) Immunology ⇓ 3) Median age of death ⇓ 4) Hospitalizations ⇓ 5) Nursing homes ⇓ 6) Overall mortality ⇓ 7) Influenza comparison ⇓ 8) Seroprevalence per country ⇓
1) Antibody studies
The covid infection fatality rate (IFR) depends on demographics (age and risk structure), public policies (e.g. protection of care homes), and medical treatment quality. In most Western countries, the median age of covid deaths is 80+ years and about 50% of deaths occurred in care homes (s.b.)
For comparison, the IFR of seasonal influenza, against which prior immunity and vaccines exist, is about 0.05% to 0.1%; the IFR of epidemic and medium pandemic influenza, such as in 1936, 1951, 1957 and 1968, is about 0.3%; the IFR of the 1918 pandemic influenza was about 2%. (Source)
In terms of covid-19 IFRs, an important difference exists between places with and without a partial or total collapse of local health and elderly care, and between the early and late pandemic phase. In the following table, NNH refers to the non-nursing home population (see section 5).
| Country | Published | Population | IFR (%) | Source |
| Global | ||||
| Low estimate | Oct. 2020 | 51 locations Below 70 years |
0.20¹ 0.04¹ |
Ioannidis |
| High estimate | Sept. 2020 | 24 locations | 0.68 | GMK |
| Africa | ||||
| Kenya | July 2020 | National | <0.1 | Uyoga |
| Malawi | Aug. 2020 | National | <0.1 | Grace |
| Asia | ||||
| India | July 2020 | Delhi Mumbai |
0.14 0.23 |
India |
| Indonesia | Jan. 2021 | National | 0.10 | UOI |
| Iran | May 2020 | Guilan province | 0.12 | Shakiba |
| Europe | ||||
| Austria | June 2020 | Ischgl (NNH) | 0.26 | von Laer |
| Belgium | Dec. 2020 | General population Incl. care homes 40 to 49 years |
0.58 1.47 0.05 |
Hens |
| Denmark | April 2020 | Blood donors (<70y) | 0.08 | Erikstrup |
| England | Aug. 2020 (low est.) |
General (MCT) General (ONS) |
0.30 0.49 |
CEBM |
| Aug. 2020 (high est.) |
General population Incl. care homes 45 to 64 years Below 44 years |
0.90 1.43 0.50 0.03 |
Ward | |
| Germany | May 2020 Nov. 2020 |
Heinsberg (NNH) Munich (NNH) |
0.36 0.48² |
Streeck LMU |
| Iceland | Sept. 2020 | General population Below 70 years |
0.30 0.10 |
NEJM |
| Italy (Lombardy) |
Aug. 2020 | Below 70 years Below 50 years 80+, first phase 80+, second ph. |
0.43 <0.01 30.40 8.10 |
Poletti |
| Spain (early phase) |
Aug. 2020 | Confirmed covid Excess deaths Below 50 years Below 40 years |
0.82 1.07 <0.10 <0.03 |
Pollan |
| Sweden | June 2020 | Stockholm (NNH) Stockholm <70y |
0.35³ 0.09 |
FOHM |
| Switzerland | July 2020 Aug. 2020 |
Geneva (NNH) Zurich (NNH) |
0.324 0.304 |
Perez Aguzzi |
| Latin America | ||||
| Brazil | Sept. 2020 Sept. 2020 |
Maranhao Manaus |
0.17 0.28 |
da Silva Buss |
| Colombia | June 2021 | National | 0.27 | Guzman |
| United States | ||||
| Indiana | Sept. 2020 | General population | 0.26 | AIM |
| Santa Clara | April 2020 | General population | 0.175 | Bendavid |
| Miami-Dade | April 2020 | General population | 0.185 | Miami |
| Los Angeles | April 2020 | General population | 0.205 | Sood |
| New York City (early phase) |
June 2020 | Overall | 0.70 | Stadlbauer |
| June 2020 | Confirmed Probable 25 to 44 y. <25 years |
1.10 1.45 0.12 0.01 |
Yang | |
1) Median values; 2) 0.76% including nursing homes (36% of deaths); 3) 0.58% including Stockholm nursing homes (about 40% of deaths, see page 23); 4) 0.64% and 0.60% including nursing homes; 5) These US studies may underestimate the true IFR, as they were done early during an accelerating pandemic.

The above chart shows the very significant difference between IFRs in the entire population (including nursing homes, left) and in the non-nursing home population (right) at the example of Belgium. The IFR in 85-year-old nursing home patients (about 20%) is almost 20 times higher than the IFR in people of the same age outside of nursing homes (about 1%).
2) Immunological aspects
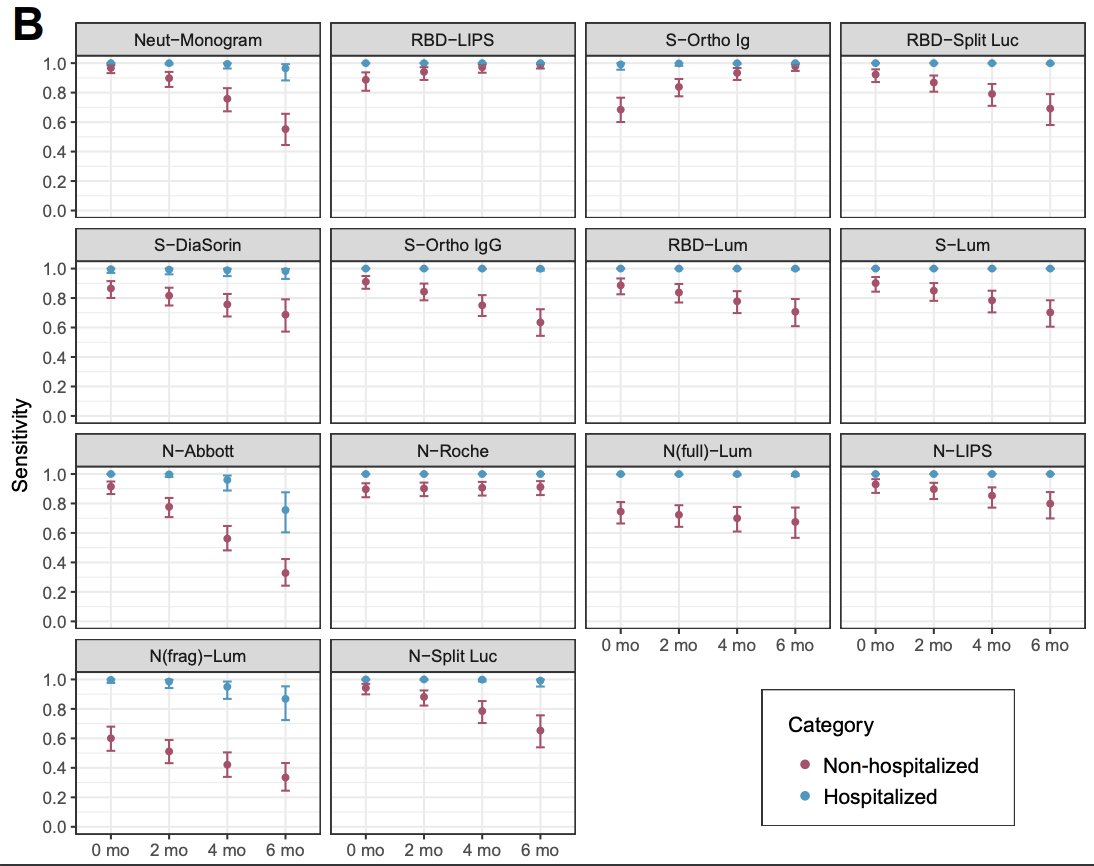
Immunological research indicates that serological antibody studies, which measure antibodies in the blood (mostly IgG), may detect only about 50% to 80% of all coronavirus infections, depending on the sensitivity of the assay, the timing of the test, and the population tested.
This is because some people neutralize the coronavirus primarily with their mucosal (IgA) or cellular (T-cells) immune system and develop only mild symptoms or no symptoms. These people may develop no measurable IgG antibodies or may show them only for a certain time.
The following chart shows that six months after an infection, the sensitivity of antibody assays in non-hospitalized patients ranged from 98% (e.g. Roche) to just 30% (e.g. the widely used Abbott assay). Thus, some antibody studies may underestimate infections and overestimate IFRs.
3) Median age of Covid-19 deaths per country
Half of all deaths were below, half were above the median age.
| Country | Median age |
Source |
| Australia | 82 years | DOH |
| Austria | 82 years | EMS |
| Belgium | 86 years | IBS |
| Brazil | 70 years | MDX |
| Canada | 86 years | HCSC |
| England | 82 years | NHS |
| France | 84 years | SPF |
| Germany | 83 years | RKI |
| Italy | 82 years | ISS |
| South Africa | 62 years | SAC |
| Spain | 82 years | MDS |
| Sweden | 84 years | FOHM |
| Switzerland | 86 years | BAG |
| USA | 78 years | CDC |
The following chart shows the percentage of covid deaths per age group in various countries. While in many European countries, up to 90% of deaths affect people older than 70 years of age, in many Latin American countries, up to a third of deaths affect people younger than 60 years of age.

4) Hospitalization rate
Initial estimates based on Chinese data assumed a very high 20% hospitalization rate, which led to the strategy of ‘flattening the curve’ to avoid overburdening hospitals. However, population-based antibody studies (see above) have since shown that actual hospitalization rates are closer to 2%, which is comparable to hospitalization rates for influenza (1 to 2%).
The US CDC found that Covid-19 hospitalization rates for people aged 65 and over are “within ranges of influenza hospitalization rates”, with rates somewhat higher for people aged 18 to 64, but “much lower” (compared to influenza) for people under 18.
In hotspots like New York City, the hospitalization rate based on antibody studies was about 2.5% (20% or 1.7 million people with antibodies and 43,000 hospitalizations by early May 2020). The lower-than-expected hospitalization rate may explain why many covid-19 ‘field hospitals’, e.g. in the US and the UK, remained largely unused.
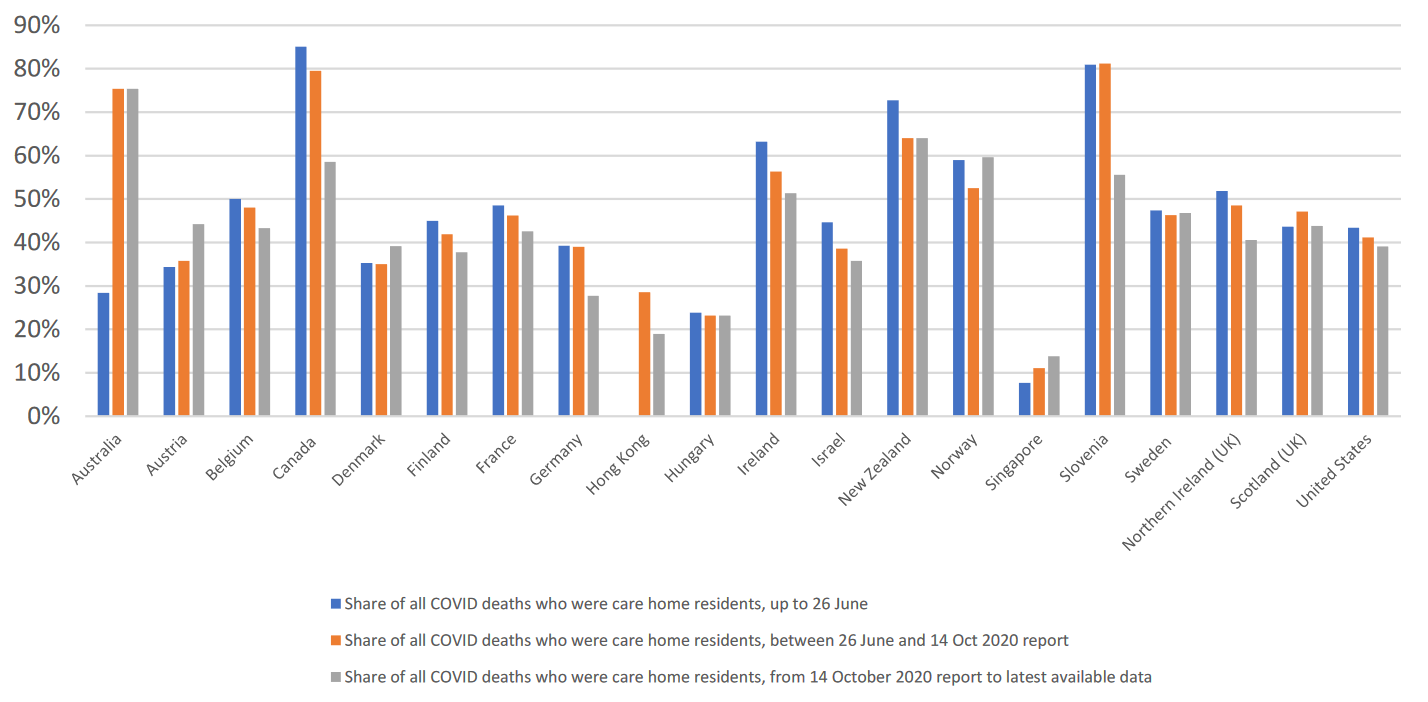
5) Percentage of Covid-19 deaths in care homes
In most Western countries, deaths in care homes account for 30% to 60% of all covid deaths. In Canada and some US states, care homes account for up to 80% of all covid-related deaths. In Sweden, deaths in nursing homes and nursing apartments account for 70% of all deaths.
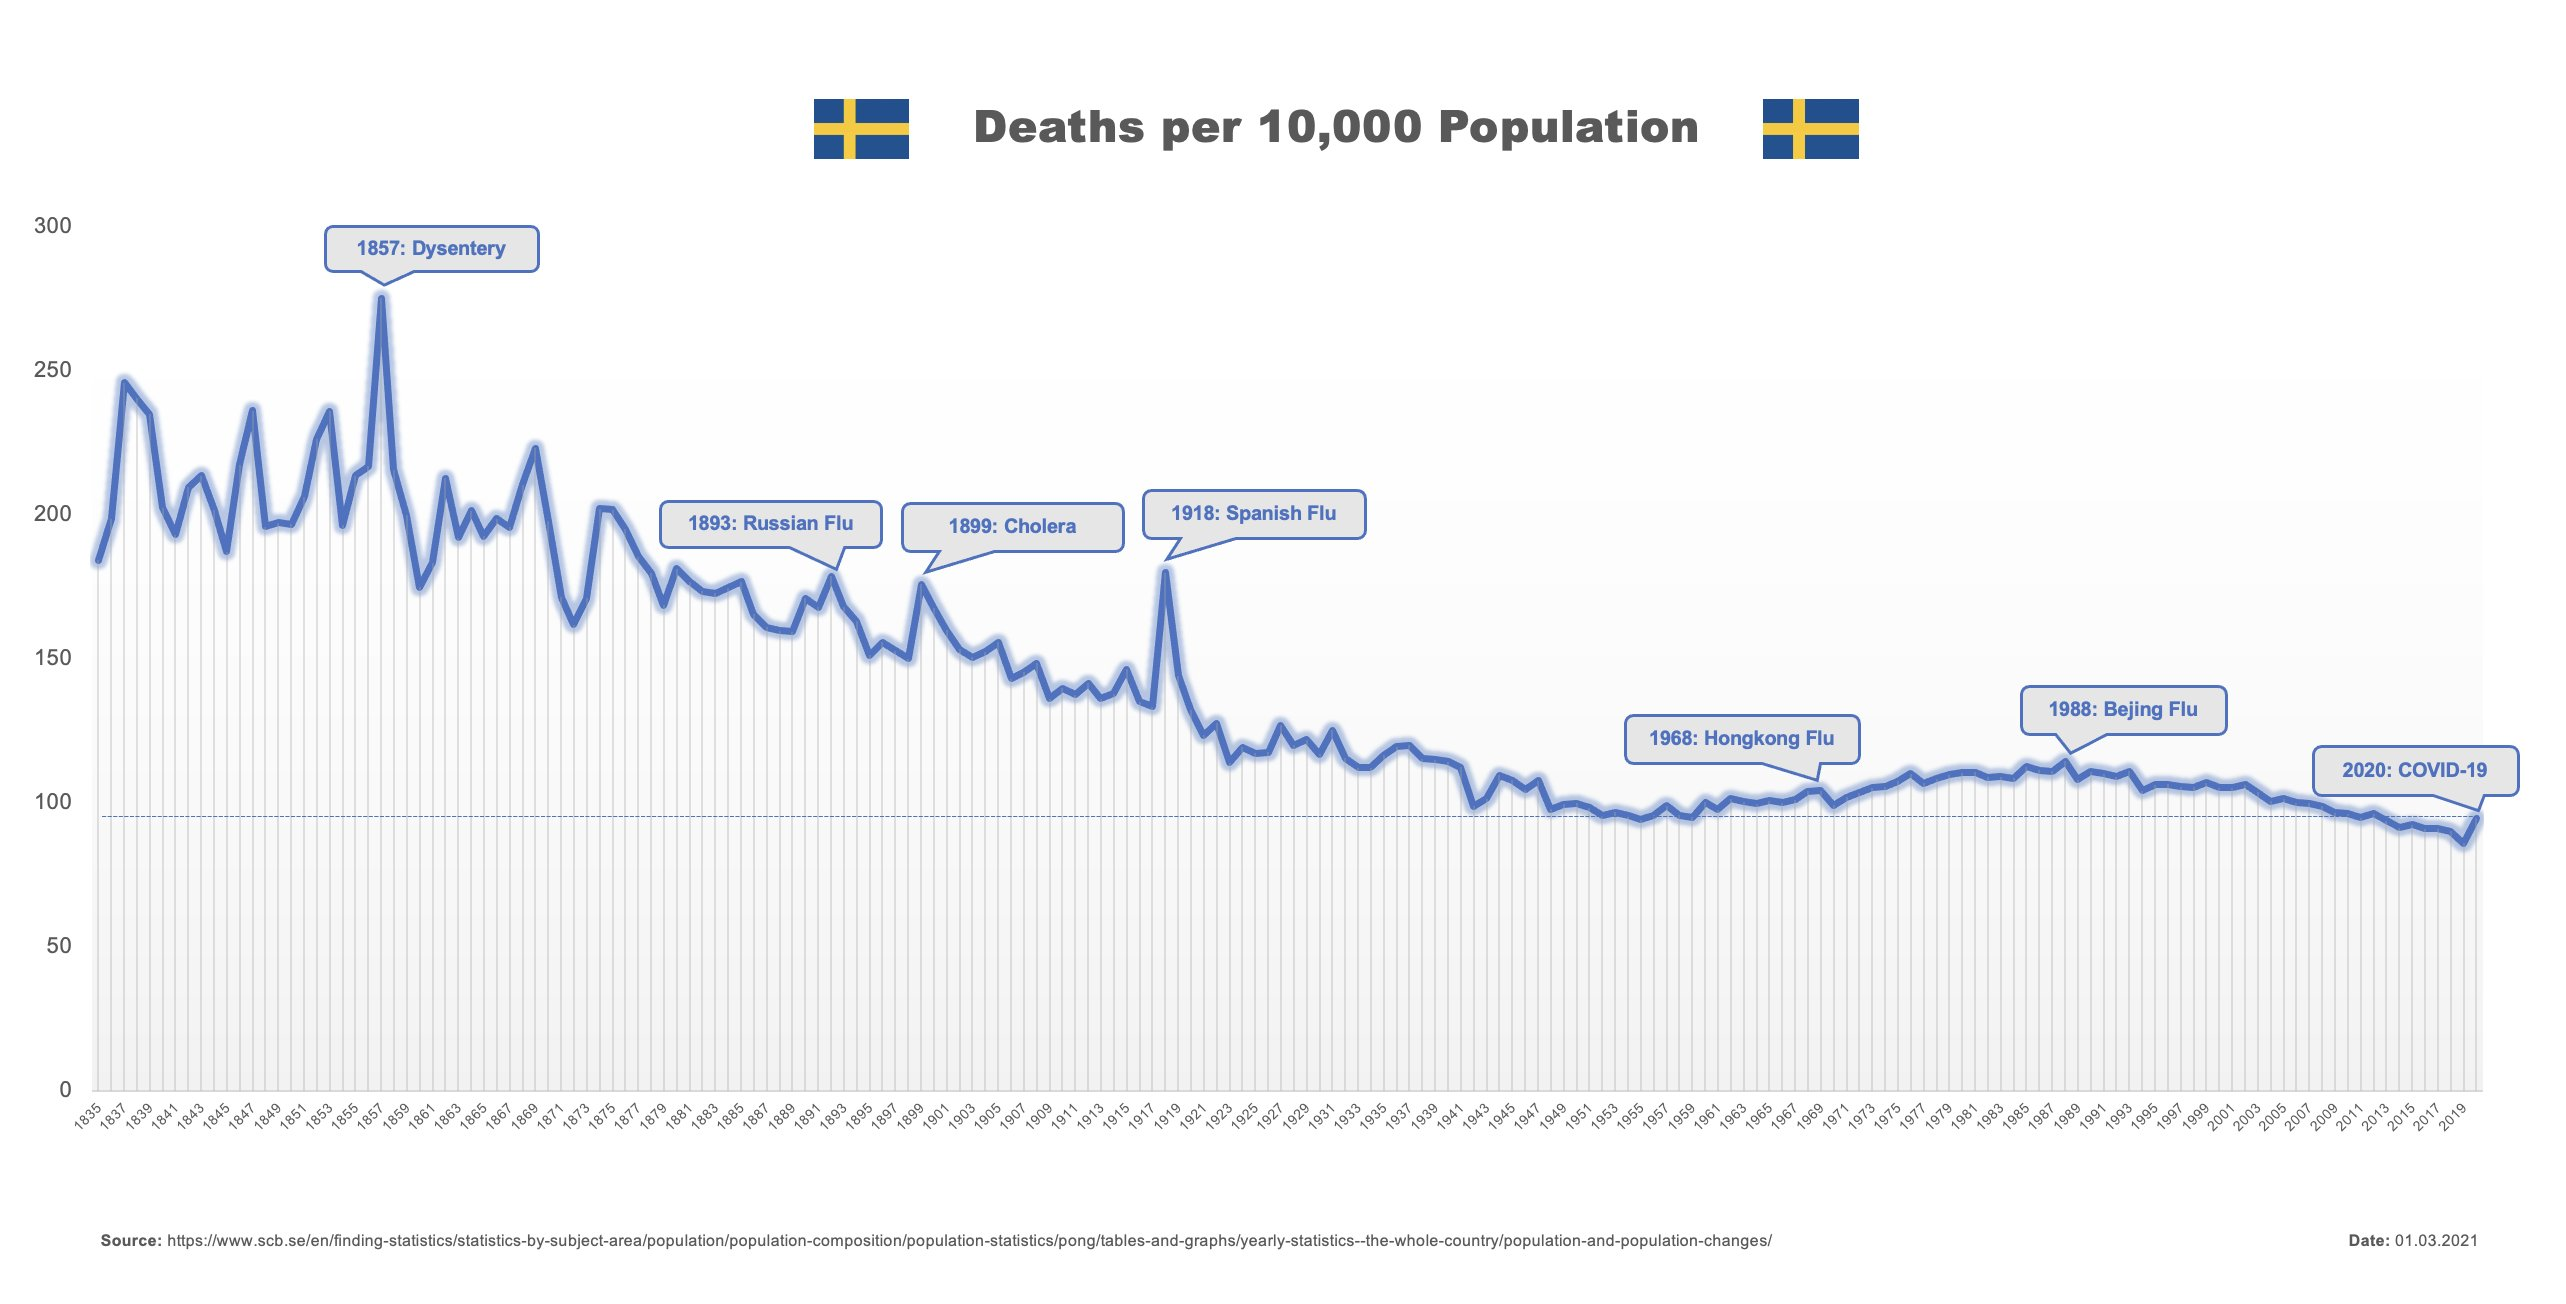
6) Overall mortality
By the end of March 2021, there were close to 3 million covid deaths in close to 8 billion people. At a global infection attack rate of 10% to 30%, this results in an average global covid lethality (IFR) of 0.1% to 0.35% and a global covid mortality of about 0.035%. By comparison, the 1918 flu pandemic had a global mortality of about 2.3% (40 million deaths in 1.8 billion people).
See also: Covid-19 Mortality: An Overview (March 2021)


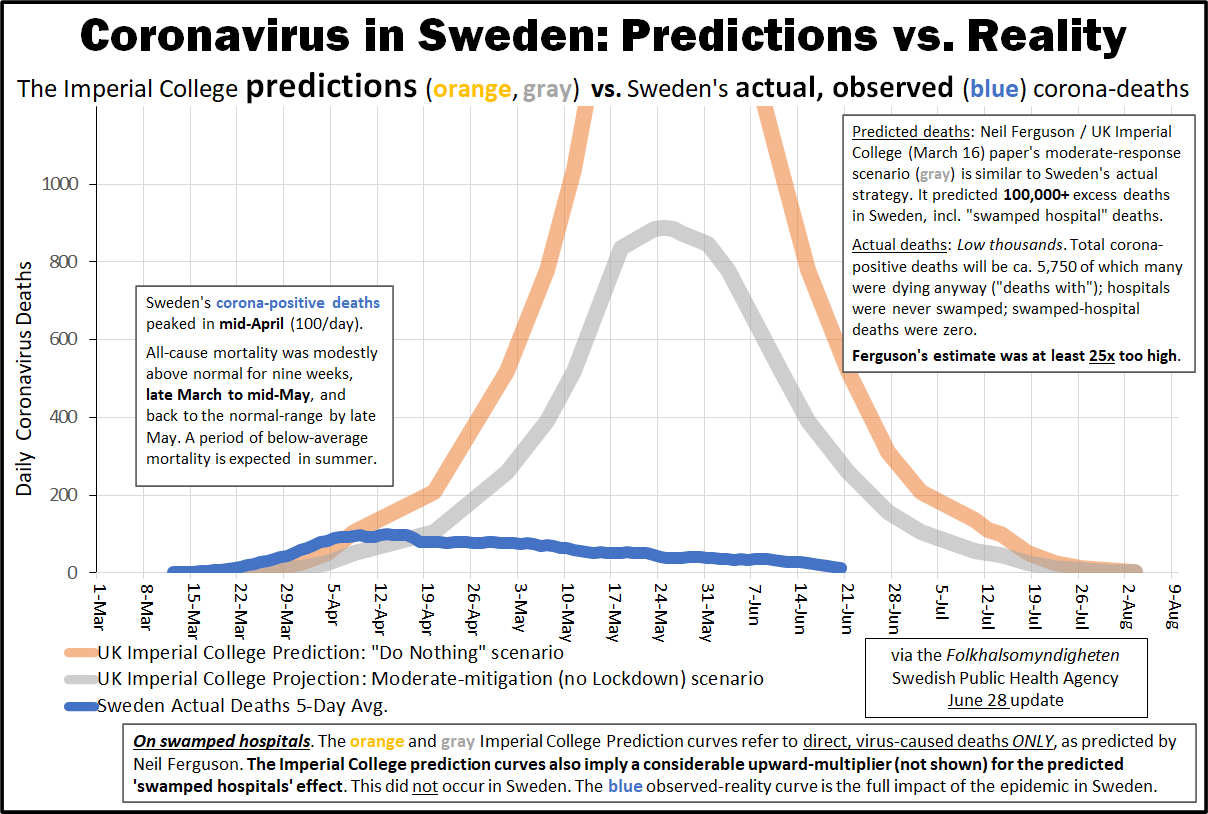
A comparison between the number of coronavirus deaths predicted by the influential model of Imperial College London (no measures or moderate measures) and the actual number of deaths in Sweden indicates that the model significantly overestimated the impact of the epidemic:
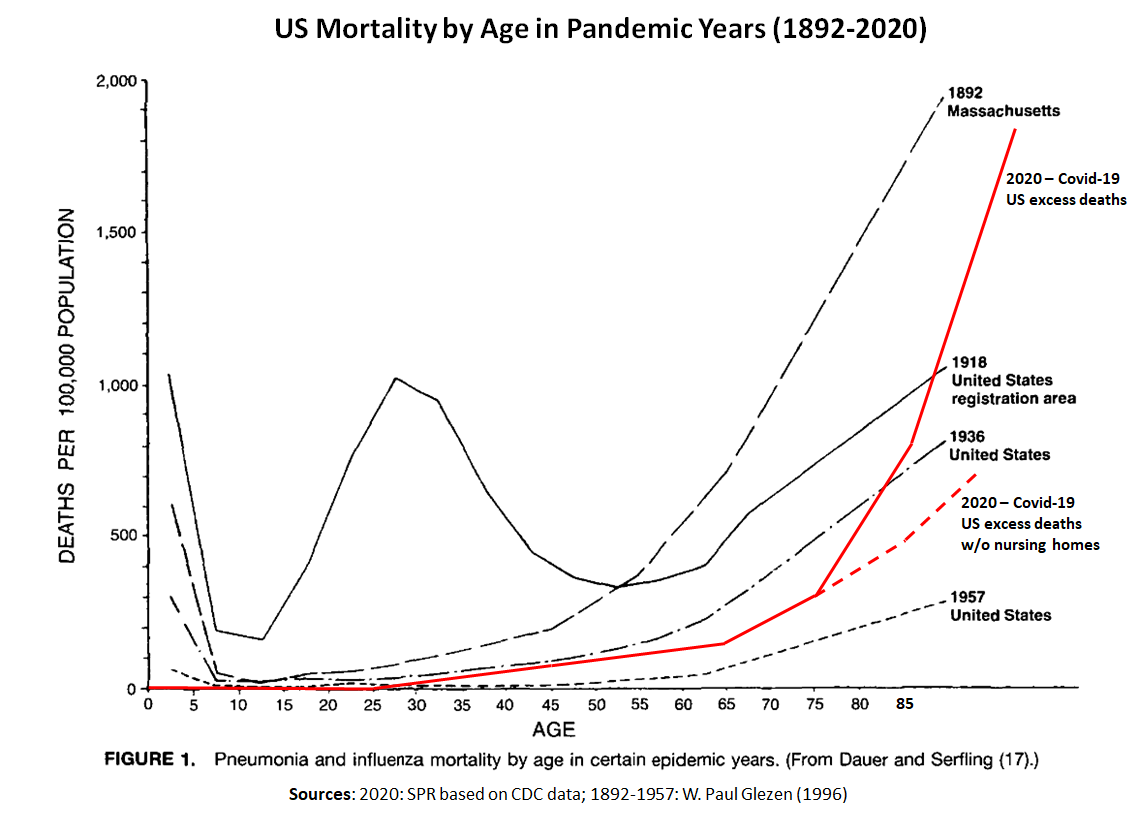
The following chart shows US mortality by age in previous pandemic years compared to 2020 US excess mortality, which consisted primarily (>75%) of confirmed and suspected covid-19 deaths, according to the CDC. To learn more about this comparison, please read this article.
8) Antibody seroprevalence per country
Percentage of people with measurable antibodies to the new coronavirus.
See also: The SeroTracker Project
| Country | Date | Region | Antibodies | Source |
| Europe | ||||
| Austria | Dec. 2020 | National | 3% | Weidner |
| Belgium | Dec. 2020 June 2020 |
Flanders Brussels |
13% 12% |
Mariën Herzog |
| Croatia | Feb. 2021 | National | 25% | MDPI |
| Denmark | Jan. 2021 | National Soc. housing |
6% 17% |
Fogh |
| England | June 2021 May 2021 May 2021 |
School staff National London |
25% 14% 20% |
PHE ICL |
| Estonia | Mar. 2021 | National | 20% | Jogi |
| Finland | Feb. 2021 | National | 5% | FIH |
| France | Mar. 2021 | National Paris region |
21% 37% |
PFR |
| Germany | Oct. 2021 Mar. 2021 Dec. 2020 June 2020 April 2020 |
National National National National Gangelt |
25% 15% 5% <2% 15% |
RKI |
| Hungary | June 2020 | National Budapest |
0.7% 0.8% |
Merkely |
| Iceland | July 2020 | National | 0.9% | NEJM |
| Ireland | Aug. 2020 | National Dublin |
1.7% 3.1% |
HSPC |
| Italy | Jan. 2021 July 2020 July 2020 July 2020 July 2020 |
Milan National Bergamo Lombardy Sicily |
13% 2.5% 38% 7.5% 0.3% |
PLOS ISTAT |
| Netherlands | Feb. 2021 | National South |
12% 24% |
RIVM |
| Norway | Dec. 2020 | National | 2% | Anda |
| Poland | May 2021 | Wrocław (IgG) Wrocław (IgA) |
35% 52% |
Budziar |
| Portugal | Oct. 2020 | National | 3% | Castro |
| Russia | June 2020 | National Moscow Petersburg |
14% 20% 5.7% |
TMT TMT EUSP |
| Spain | Dec. 2020 Dec. 2020 |
National Madrid |
10% 19% |
Franco |
| Sweden | Jan. 2021 Nov. 2020 May 2020 |
Linkoping Stockholm National |
36% 31% 5% |
Sjowall DNSE FOHM |
| Switzerland | June 2021 Jan. 2021 Nov. 2020 |
Geneva Zurich Ticino |
33% 11% 16% |
UGE BAG |
| Ukraine | Jan. 2021 | National | 43% | LNMU |
| Americas | ||||
| Brazil | Aug. 2020 Feb. 2021 |
Maranhao Sao Paulo |
40% 25% |
Silva SPS |
| Canada | Jan. 2021 June 2020 June 2020 June 2020 |
National Quebec Ottawa Vancouver |
3.0% 2.2% 1.3% 0.6% |
STE BCA |
| Colombia | Dec. 2020 | Metropolitan | 20% | MDPI |
| Mexico | Dec. 2020 Feb. 2021 |
National | 33% | Medina |
| Paraguay | Dec. 2020 | National | 30% | MSP |
| USA | Mar. 2021 | National Vermont Oregon California Florida Texas New York Mississippi S. Dakota |
35% 6% 11% 26% 29% 32% 35% 39% 48% |
CDC C19P |
| Asia | ||||
| China | Apr. 2020
May 2020 |
Wuhan Hubei Rest Wuhan |
4.5% 0.5% <0.1% 2.4% |
Lancet |
| India | Oct. 2021 July 2021 Jan. 2021 |
Delhi National National |
97% 68% 22% |
Delhi ICMR NCDC |
| Indonesia | Jan. 2021 Mar. 2021 |
National Jakarta |
15% 45% |
Govt. DKI |
| Japan | Dec. 2020 July 2020 |
Yokohama Tokyo |
3.7% 1.2% |
Taira Nawa |
| South Korea | Dec. 2020 | National | 0.5% | Nah |
| Thailand | March 2021 | National | 0.2% | Plos |
| Middle East and Africa |
||||
| Congo | July 2020 | Brazzaville | 20% | IJID |
| Iran | July 2020 | National Qom Rasht |
17.1% 58.5% 72.6% |
Lancet |
| Israel | Sept. 2021 June 2021 Sept. 2020 |
National National Bnei Brak |
35% 9% 30% |
Morris Kovler Haaretz |
| Jordan | Feb. 2021 | National | 28% | IJID |
| Kenya | March 2021 | National Nairobi |
49% 62% |
Uyoga |
| Madagascar | May 2021 | Capital | 65% | Razaf. |
| Nigeria | Oct. 2020 | Lagos | 23% | NCDC |
| Saudi Arabia | Aug. 2020 Nov. 2020 |
National National |
10% 20% |
Alharbi |
| South Africa | Jan. 2021 | National | 50% | MDX |
